The figure or the record
Sensor Tower's state-of-short-drama report, retrieved 16 September 2026, states roughly $750 million in in-app-purchase revenue across short-drama apps in the first quarter of 2026, up 20% year on year, alongside more than 850 million downloads, up 140%. Omdia's press release, dated 23 February 2026, states a modelled global microdrama revenue figure of $11 billion for 2025 and a projected $14 billion for 2026. Owl & Co, an advisory firm publishing under its Streamonomics banner and retrieved 16 September 2026, frames vertical video as a distinct format 'already worth $100B+', without citing a single dated report behind that figure on the page itself.
What the documents establish
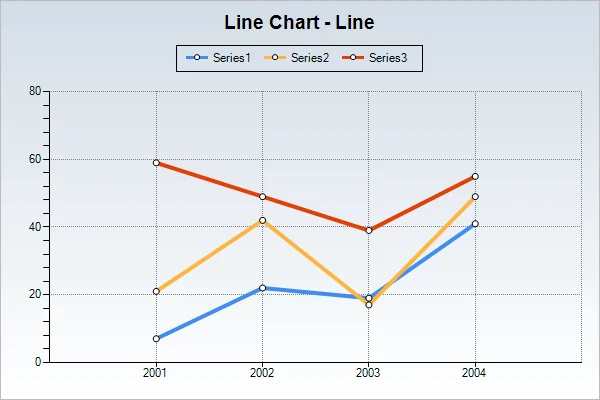
The three sources establish three different scopes for what looks like a similar subject. Sensor Tower's figure is a measured, quarter-specific, storefront-only in-app-purchase number. Omdia's figure is a modelled, annual, global revenue total that the release does not itemise by revenue line, with one year delivered and one year projected. Owl & Co's figure is a broader framing claim about a format rather than a dated, sourced market size. Placed on one chart without labels, the three would appear to describe one growing market; read against their own documents, they describe a quarter, a modelled year, and an unsourced framing statement.
Scope and caveats
None of the three firms' figures is wrong on its own terms, but none is built the same way, and the cited pages do not reconcile them with each other. A reader cannot add Sensor Tower's quarterly in-app-purchase figure to Omdia's annual total without double-counting, nor treat Owl & Co's framing number as a checkable market size without a cited source behind it.
What to watch
An editorial standard for any chart in this ledger: every line should carry its own scope, period, currency and method label, rather than a single shared axis title implying a comparability that the underlying documents do not support.
- Does each line on the chart name its own period, currency and whether it is measured, modelled or projected?
- Are quarterly and annual figures from different sources being shown on directly comparable axes?
- Is a framing figure without a cited dated source being shown alongside measured or modelled figures as though it were the same kind of number?
A chart that mixes scopes without labelling them is not misstating any single figure; it is letting the reader infer a comparison that none of the cited documents actually makes.
Sources & reading trail
Gives a measured, quarter-specific in-app-purchase and download figure with a stated store scope.
Source published: Not established · Retrieved: 16 September 2026
Gives a modelled annual global revenue total with one delivered and one projected year.
Source published: 23 February 2026 · Retrieved: 16 September 2026
Shows a broad framing figure for the vertical-video format without a cited dated source on the page.
Source published: Not established · Retrieved: 16 September 2026
Filings, releases and official documents establish the record; the scope reading and the questions are Vertical Ledger editorial analysis. This retrospective draft does not imply the site published on the event date.