Measured / app stores
Sensor Tower
$750M
Q1 2026 global IAP
The hardest public datapoint in the set: store purchases only, not the whole business.
Source ↗The field guide / Original research edition
Prepared 14 September 2026. This earlier briefing is preserved for context; its claims have not all been reverified in this design pass. The newer ledger records keep their own source dates and caveats.
01 Field guide / September 2026
A sourcing-first briefing on the mobile-native story format changing production, distribution, and the economics of attention.

02A Format in the wild
Catalogue surfaces make the unit of analysis visible: a hook, a frame, a region, and a paywall path. These are working references from the adjacent research catalogue, not a ranking.



02 Market size decoder
Vertical drama’s headline figures are often repeated as if they measure the same thing. They do not. The first job is to name the unit, the geography, and the money counted.
Read by lens
A figure earns trust when its scope travels with it.
The hardest public datapoint in the set: store purchases only, not the whole business.
Source ↗Includes China and a wider mix of subscriptions, transactions, and advertising.
Source ↗A narrower overseas market estimate, not a global total.
Context ↗Do not call this microdrama revenue. It includes advertising, shopping take rates, social video, and dedicated apps.
Source / scope ↗Editorial rule: Never compare an app-store measurement with a modeled all-channel forecast without naming the missing revenue and the different geography.
03 Where the scroll goes
The category’s growth engine is not one country or one app. It is a network of market-specific acquisition loops, localization, and monetization habits.
QuestMobile’s February 2026 snapshot across standalone apps and WeChat mini-programs. China remains the category’s economic center of gravity.
~83% of global revenue / Omdia estimateOmdia’s Q4 2025 mobile-usage comparison put ReelShort ahead of Netflix, Prime Video, and Disney+ on daily mobile minutes in the US.
Sensor Tower says Southeast Asia, Latin America, and India together accounted for more than three-quarters of global short-drama downloads in Q1 2026.

04 The AI inflection
China’s 2026 output explosion changes the supply curve. It does not settle the harder question: which stories earn repeat attention?
About 122,000 were reported as AI-generated in estimates attributed to the China Netcasting Services Association.
Owl & Co’s 1H26 report, summarized by Forbes, describes an output-attention paradox: more titles did not produce more viewing.
Forbes / Owl & Co, Aug 2026 ↗Cheaper video is not cheaper attention. The defensible layer moves upstream to IP, taste, localization, rights, and distribution.
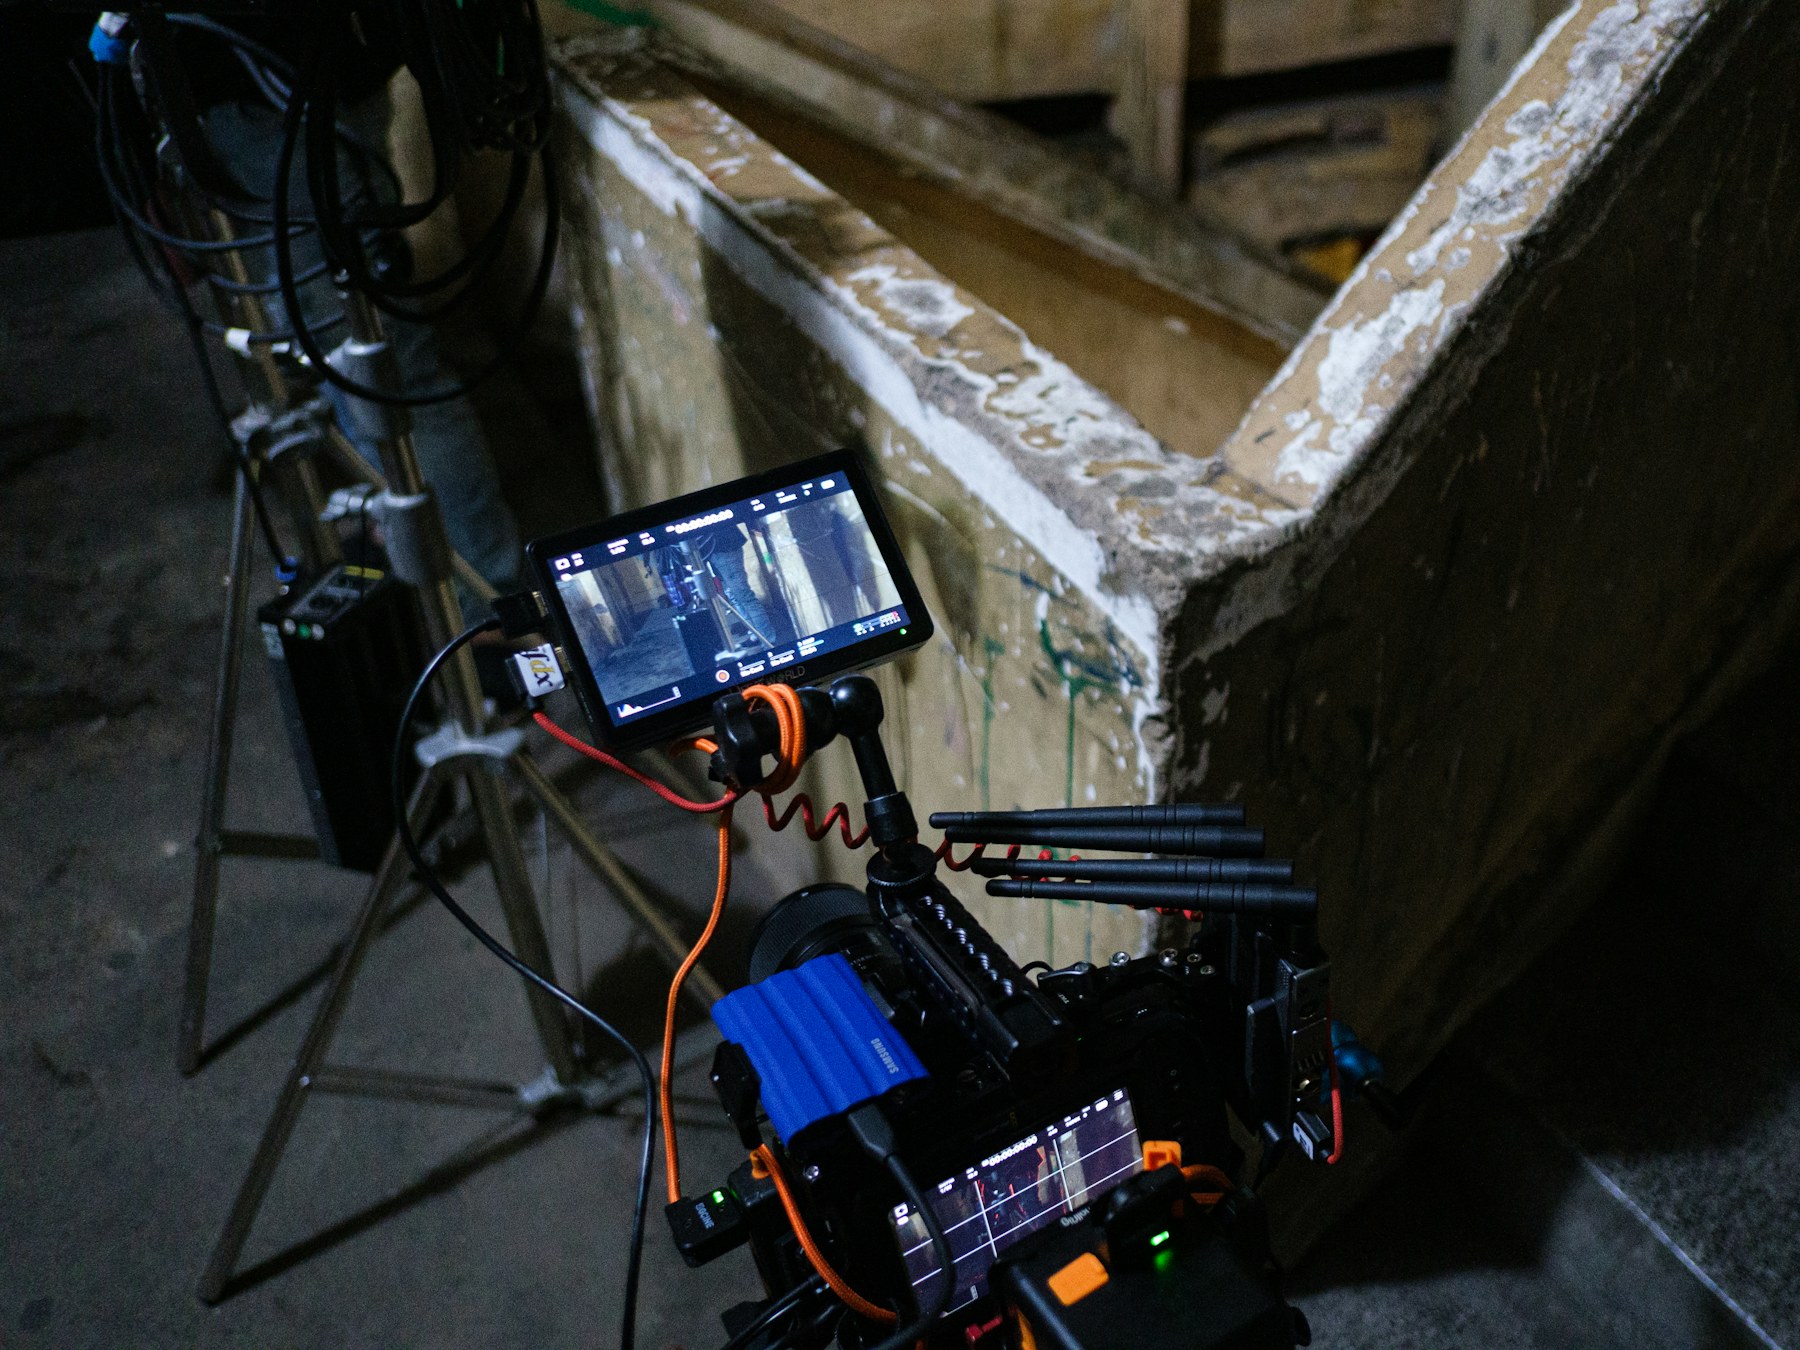
VISUAL EVIDENCE What the pipeline looks like
Images do different jobs here: show the toolchain, show the edit, and show the audience. The point is not decoration—it is to keep the abstract economics tied to real screens, real sets, and real viewing behavior.


05 Production economics
Production is fast and compact. The business is a loop: acquire attention, hook it, monetize it, then refresh the creative before fatigue wins.

Trade and production guides place a typical 60–100 episode US series in this range; geography and union status change the math quickly.
reported range / mixed sourcesLocation grouping, compressed prep, and vertical-native blocking allow a season to move at a pace conventional one-hour drama cannot match.
production heuristicSecondhand industry analyses put user-acquisition spend several times above production cost. Creative decay makes the marketing machine the operating system.
analyst estimate / verify per titleCommon mechanics: 8–15 free episodes, then coin unlocks of roughly $0.10–$0.20 per chapter. Pricing varies by region and promotion.
observed pattern / region-sensitive06 Labor, likeness, law
The format’s speed can make contracts look like friction. The current US and Chinese signals say the opposite: the faster the pipeline, the more specific the permissions need to be.
A dedicated union agreement covers qualifying US verticals: 9:16 programs, chapters of three minutes or less, and budgets generally under $300,000 (or $350,000 with background actors covered).
DGA says its New Media Sideletter extends to vertical work, with negotiable rates and a flexible signatory path for modest-budget productions.
Read the guild note ↗China’s AI drama boom has produced marketplaces for face licensing—and court pressure on platforms that fail to review recognizable AI likenesses.
Rest of World on ActID ↗Holywater’s musical vertical became SAG-signatory after Hannah Stocking joined, a useful marker of the format’s path into mainstream production practice.
TheWrap, April 2026 ↗This is an editorial briefing, not legal advice. Agreement coverage, rates, residuals, AI permissions, and local rules should be checked against the current contract and counsel for each production.
07 The whitespace
The best entry is not another generic “what is microdrama?” explainer. It is the source trail nobody else keeps clean.
Publish every estimate with scope, methodology, primary URL, and a plain-English “what this does / does not count.”
Manually classify titles by platform with a stated method. Pair it with a living legal and labor tracker.
Use transparent charts for reach; reserve production economics, regional briefings, and deal analysis for paid reports.
Source reputation compounds. An internally inconsistent number breaks the exact trust a data publication is selling.
08 Reference shelf
We studied live vertical-drama indexes, entertainment-intelligence vendors, and visual-data publishers. These are the patterns worth borrowing for Vertical Ledger.
The live edition leads with an issue date, a title count, a platform count, and a clear distinction between its index and its paid report.
Its editorial promise is simple: every number links to a source, and unsourced claims stay out. That makes the site feel more like a research instrument than a trend page.
The methodology page explains what signals are collected, how effort is weighted, and why its demand metric is not just social buzz.
Its pitch rubric starts with a thesis, asks whether the idea is uniquely visual, and expects a data roadmap before a flashy chart.
Its Charts project gives every visual a durable home, with source links and reusable graphics instead of letting charts disappear inside old stories.
09 Method
Vertical Ledger separates measured data, modeled estimates, trade reporting, and editorial inference. When sources disagree, the disagreement stays visible.
Revenue, downloads, minutes, MAU, titles, or the full vertical-video economy.
Geography, date, channel, app-store coverage, and whether advertising or web checkout is included.
Primary measurement, analyst model, secondhand estimate, or editorial inference.
10 Sources / references
Selected sources used for this issue. The attached field guide remains the working research archive; this page keeps the most decision-relevant trail visible.
Many market figures are estimates, not audited totals. Pricing varies by region and promotion. AI share, platform MAU, regional CAGR, and valuation claims are especially time-sensitive or single-sourced. This issue favors Sensor Tower for app-store measurements and treats the broader numbers as scoped models.