A method note, not another market-size estimate
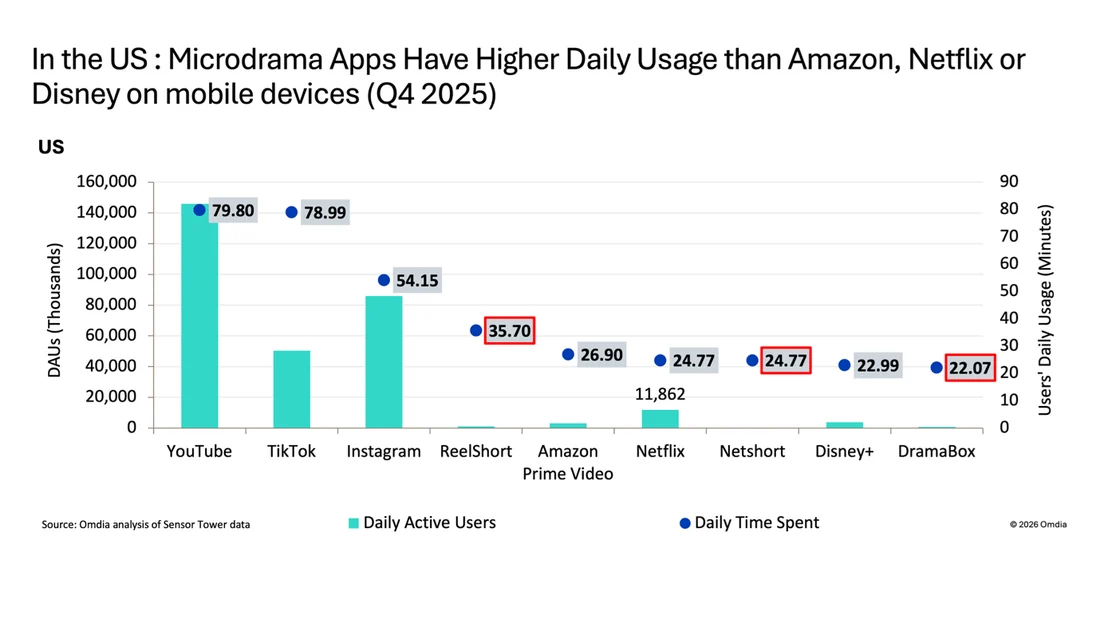
Omdia's 23 February 2026 release compares U.S. mobile use in Q4 2025. Its ReelShort figure is 35.7 minutes per user per day. That describes intensity among users, not the number of people reached. Our main Omdia ledger record covers the announcement; this companion explains how to read the source chart without expanding its claim.
Two axes, two questions
The original graphic below uses bars for daily active users and dots for daily minutes. Its left axis is labelled in thousands of users; its right axis is labelled in minutes. A tall dot is not a tall audience bar. A reader who compares their heights without checking the scales has silently compared different units.
There is a further source distinction worth preserving: the release's prose discusses monthly active users, while the chart labels its user series daily active users. We do not relabel one as the other or combine them into a calculation. This is a reason to keep the original figure visible beside a summary rather than stripping away its axes.
A hypothetical example
Consider two imaginary services measured over the same day with the same method. One has 100 users watching for 30 minutes each; the other has 1,000 users watching for 10 minutes each. The first leads on minutes per user. The second leads on users and total minutes. These deliberately invented round numbers illustrate the arithmetic; they are not estimates for any real platform.
Even that multiplication requires compatible definitions. A monthly user count multiplied by an average daily intensity is not automatically the day's total viewing. Nor should mobile-app minutes be presented as all-screen consumption. The population, time window and device coverage must travel with the number.
The reader's checklist
Before using an attention comparison, ask what is counted, who is included, which devices are measured and whether the series share a period. Then ask whether the conclusion concerns engagement, reach, total time or revenue. Each is a different proposition. This note supports a narrow reading of the published comparison; it does not independently validate the underlying panel or establish profitability, retention or title-level success.
Sources & verification
The primary source below was opened on 19 September 2026. Company and analyst statements are attributed; the workflow and reading frameworks are editorial analysis.
- omdia.tech.informa.com
Microdramas overtake streamers on mobile engagement, says Omdia ↗
Source date: 2026-02-23 · Event: 2026-02-23 · Retrieved: 2026-09-19
Opened release and inspected original chart: mobile minutes, measurement period and distinction between chart DAU and prose MAU. Underlying panel not independently audited.