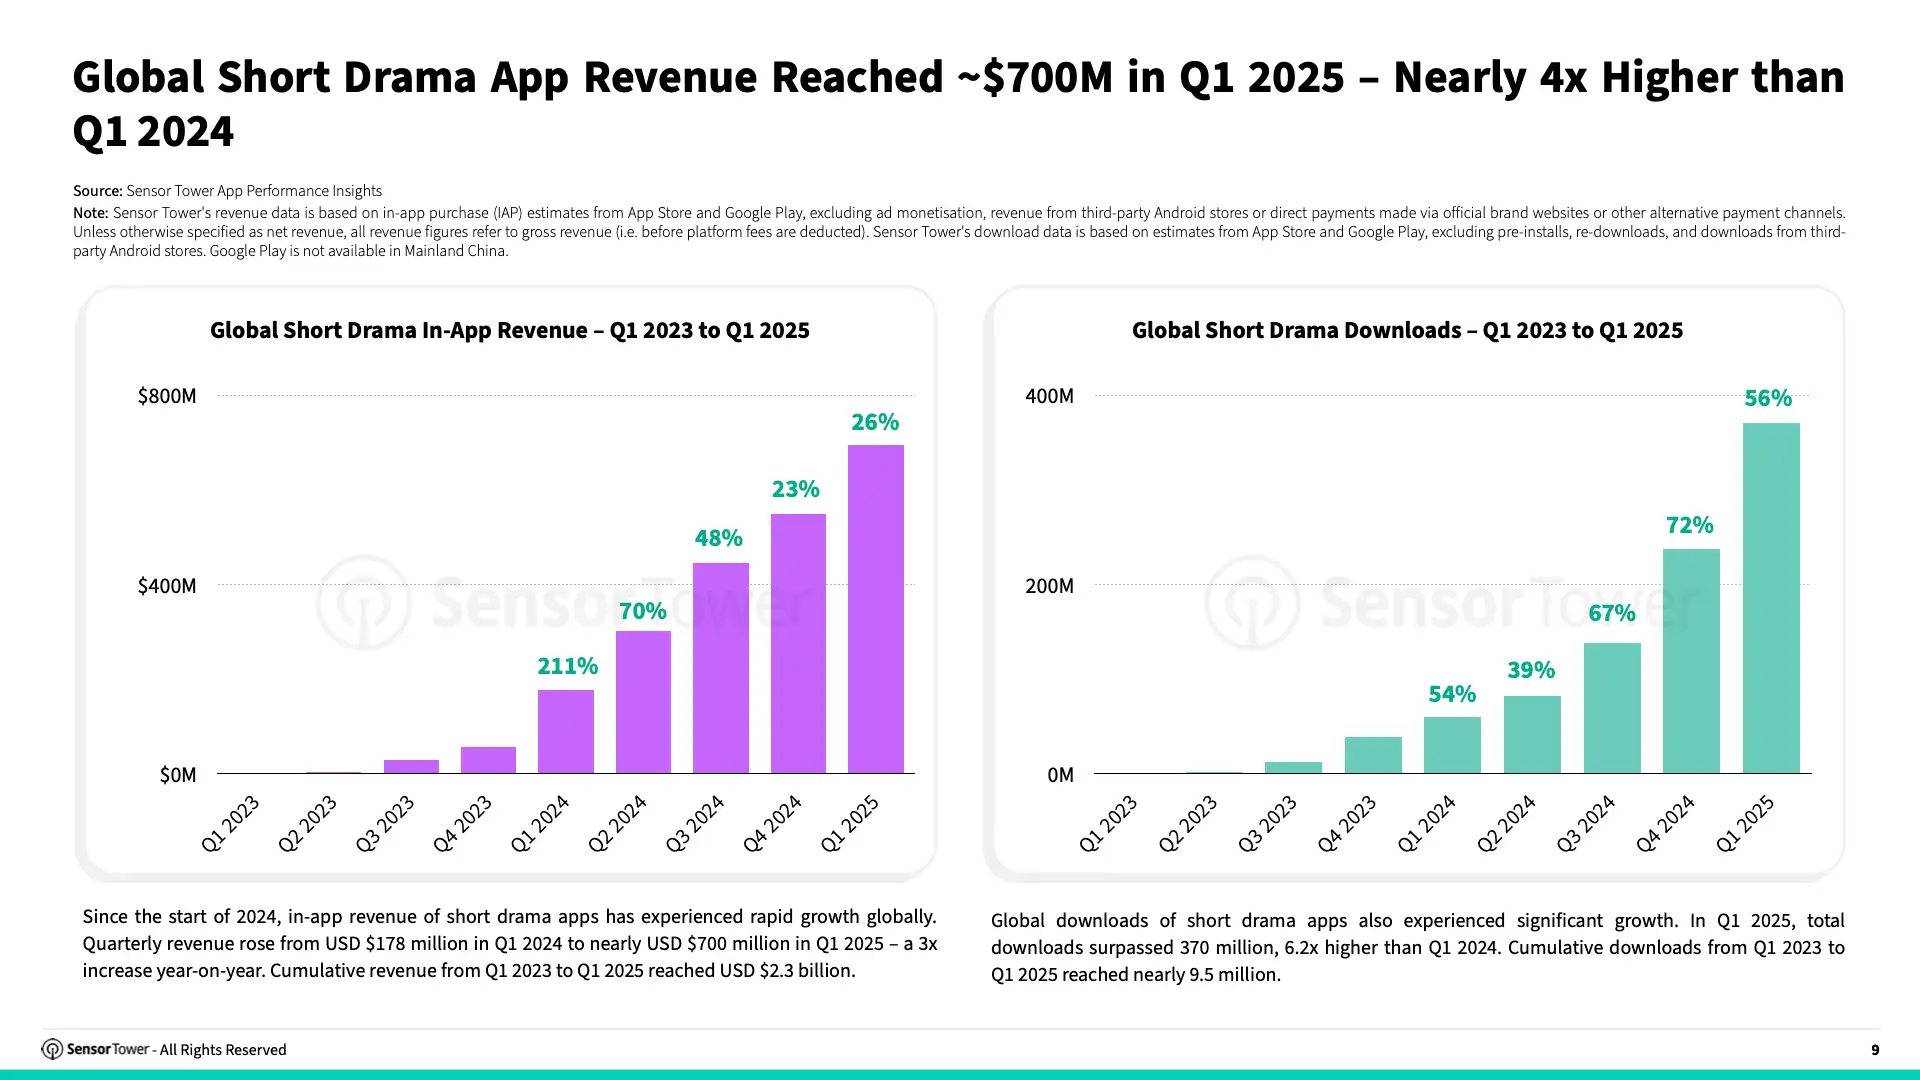
Nearly $700 million is a strong IAP signal, not a complete revenue total; retaining that distinction protects every later market comparison.
The measured step-up
Sensor Tower estimated short-drama IAP at nearly $700 million in Q1 2025, against $178 million a year earlier. The U.S. represented 49%. This measures App Store and Google Play purchases, excluding advertising, web payments and third-party Android stores. Those boundaries matter as much as the growth rate.
An install is not a payment
Our reading: an acquisition map and a revenue map answer different operating questions. A production team choosing a language needs to consider the audience it can serve; a distributor pricing a product needs to consider how that audience pays. Ranking countries by installs alone cannot resolve either decision.
Consider a hypothetical campaign that doubles installs while leaving the number of paying customers unchanged. It has expanded the top of the funnel, but it has not demonstrated improved monetization. Equally, a smaller audience can support a larger payment total if the payer rate or spending per customer is higher. These are analytical possibilities, not conclusions about a particular platform's accounts.
Why the boundary matters
Imagine the same customer buying a coin bundle first through an app and later on the platform's website. The underlying purchase relationship can persist even when the recorded channel changes. A narrow channel measure cannot determine whether an apparent decline comes from lost demand, payment migration or a changed product mix. That question needs reconciliation with the operator's own records.
The useful follow-up is a comparable-period table: app IAP, web payments and advertising, each separated from refunds, taxes and platform fees. Then add acquisition spend and content costs. Without those fields, transaction growth can demonstrate demand in a channel but cannot establish profit. This is an editorial measurement checklist, not a claim that the necessary financial breakdown is publicly available.
The original source graphic is available below with its watermark intact. Its cumulative-download caption appears inconsistent with the accompanying article and quarterly chart. We retain only the verified quarterly comparison in this entry, rather than silently correcting the publisher's image.
Sources & verification
Reported facts above are drawn from these sources. Analytical implications and hypothetical examples are our interpretation.
- Sensor Tower · Source opened
State of Short Drama Apps 2025
Page labels the report July 2025; exact day is not displayed. Retrieved 2026-09-16.
- Sensor Tower · Source opened
Sensor Tower APAC Awards 2024
Exact publication date was not exposed on the opened page. Retrieved 2026-09-16.